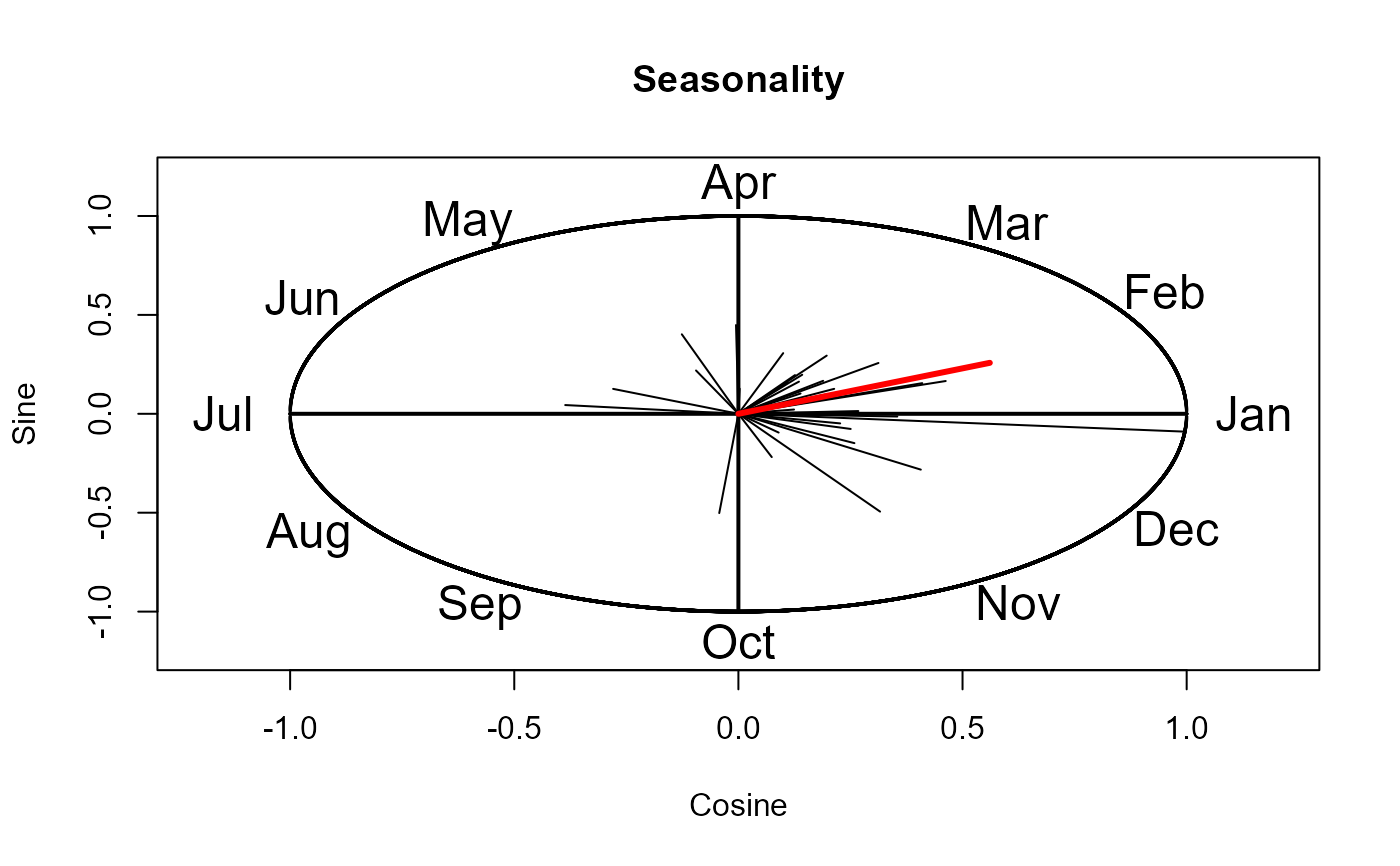
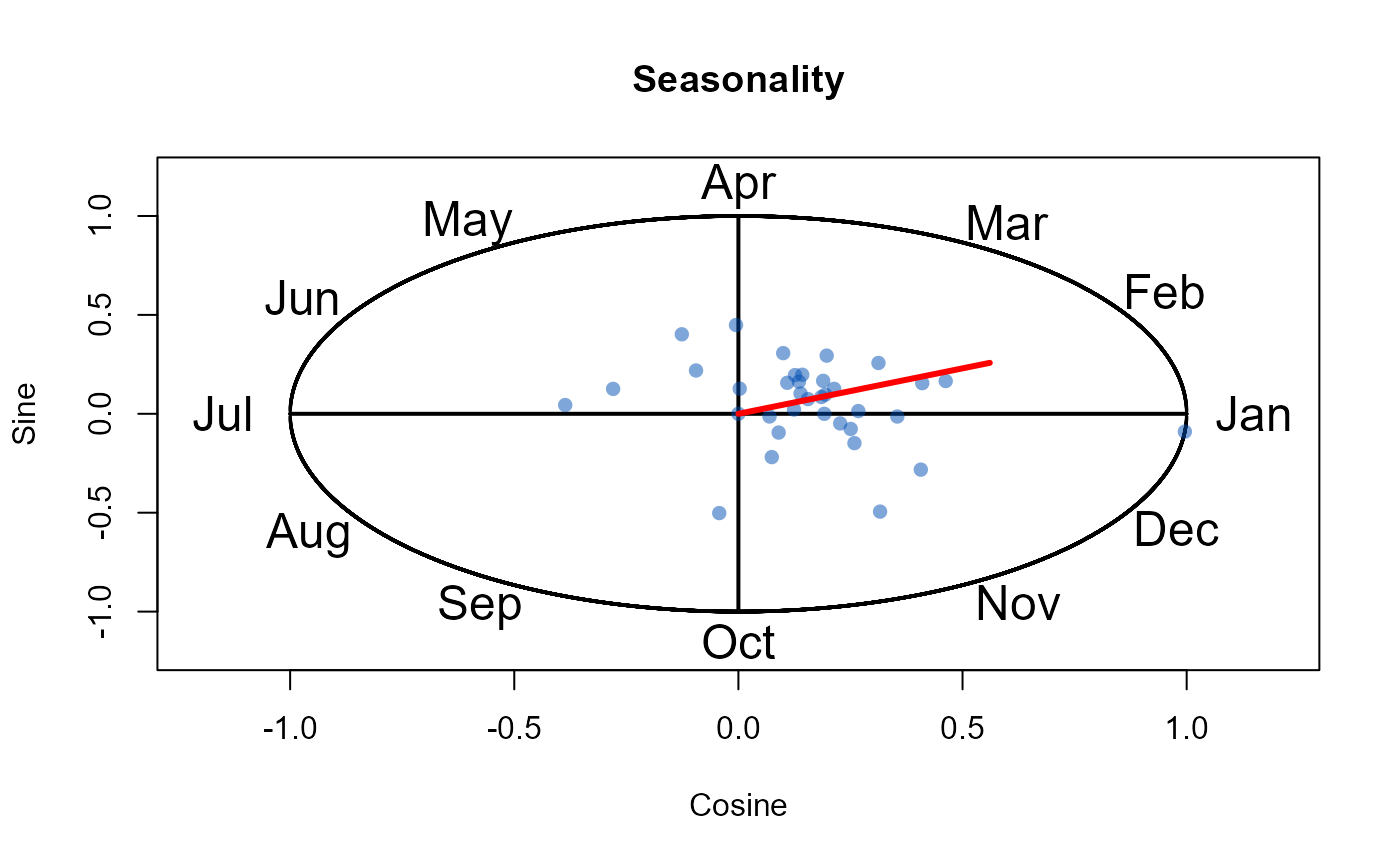
A plot to inspect the seasonality of peak flows
Details
The dots (or dark lines if Lines = TRUE) show the season of individual peaks. The red line shows the average seasonality. The longer it is the more clustered in time the peaks are.
Examples
# Get an AMAX sample and plot the seasonality
am_27083 <- GetAM(27083)
Seasonality(am_27083)


# Now do the same with lines instead of dots
Seasonality(am_27083, Lines = TRUE)
# Now do the same with lines instead of dots
Seasonality(am_27083, Lines = TRUE)