Data within the UKFE package
The UKFE package includes several datasets that can be used used in analyses. These are based on data from the National River Flow Archive (NRFA). There is a pre-processing script that converts new releases of the NRFA Peak Flow Dataset into data frames suitable for use within UKFE (this can be found in the ‘inst’ folder of the package). UKFE is updated shortly after each release to use the latest data. The user can also input their own data.
The UKFE package contains five datasets. These are:
AMPF: This contains annual maximum data from the NRFA for sites suitable for pooling and QMED. These are from the AM files with years classed as rejected removed. This is a data frame with three columns containing the date, annual maximum peak flow and the NRFA gauge ID.PeakFlowData: This contains catchment descriptors from the NRFA and calculated statistics for sites suitable for pooling and QMED. The statistics include L-moments, L-moment ratios, sample size and QMED, all derived from the AMAX data with rejected years removed. It is possible for the user to temporarily edit this data frame.ThamesPQ: This contains daily flow and catchment rainfall for the Thames at Kingston catchment from 2000-10-01 to 2015-09-30. There are three columns containing date (Date), precipitation (P) and daily mean flow (Q). Dates are in the format YYYY-MM-DD, following the ISO 8601 international standard. The data are from the NRFA (gauge 39001).UKOutline: This contains the eastings and northings around the coastline of the UK. The data are sourced from https://environment.data.gov.uk/.
These datasets each have a help file and can be viewed by typing the name of the dataset into the console, or can be saved to an object to view:
# View the first rows of the data in the console
head(PeakFlowData)
#>       AREA ALTBAR ASPBAR ASPVAR BFIHOST19scaled BFIHOST19 BFIHOST DPLBAR DPSBAR
#> 2001 553.2    213    201   0.04           0.276     0.312   0.324  30.33   97.0
#> 2002 423.5    259    178   0.15           0.300     0.315   0.351  28.71   97.3
#> 3002 237.1    439     44   0.06           0.325     0.331   0.436  15.94  218.2
#> 3003 331.7    297     61   0.07           0.295     0.309   0.359  16.79  148.2
#> 3004 187.8    300    139   0.11           0.323     0.340   0.386  19.62  140.1
#> 4005 123.7    463    123   0.03           0.289     0.299   0.389  12.97  289.0
#>      FARL2015  FARL  FPEXT   LDP PROPWET RMED.1H RMED.1D RMED.2D SAAR9120
#> 2001   0.8623 0.858 0.0555 56.78    0.65     8.3    33.0    43.7     1173
#> 2002   0.8848 0.845 0.0553 52.37    0.59     8.8    36.4    48.9     1338
#> 3002   0.9743 0.974 0.0377 31.93    0.81     9.2    43.7    65.4     1823
#> 3003   0.9217 0.915 0.0488 31.20    0.81     9.4    45.4    65.2     1887
#> 3004   0.9068 0.902 0.0557 39.41    0.82     9.8    51.1    78.6     2027
#> 4005   0.9195 0.918 0.0366 28.09    0.76     9.7    47.4    73.3     2165
#>      SAAR6190 SAAR4170 SPRHOST URBEXT2015 URBEXT2000 URBEXT1990 DrainDens
#> 2001     1117     1102   52.88      0e+00      0e+00          0     1.163
#> 2002     1217     1190   54.16      2e-04      2e-04          0     1.173
#> 3002     1784     2024   49.93      0e+00      0e+00          0     1.095
#> 3003     1896     1962   53.57      0e+00      0e+00          0     1.121
#> 3004     2250     2078   52.83      1e-04      0e+00          0     1.211
#> 4005     2145     2074   52.86      0e+00      0e+00          0     1.107
#>       CEast CNorth   Lcv LSkew LKurt  L1   L2  N Suitability QMED QMEDcd
#> 2001 284344 929781 0.121 0.139 0.158 178 21.5 49     Pooling  171    165
#> 2002 274454 916267 0.189 0.242 0.164 173 32.6 31     Pooling  157    162
#> 3002 240494 888016 0.146 0.166 0.166 188 27.4 48     Pooling  178    177
#> 3003 231272 901365 0.166 0.183 0.142 368 61.0 46     Pooling  350    220
#> 3004 239146 914664 0.152 0.261 0.203 193 29.4 17     Pooling  178    129
#> 4005 220288 850359 0.145 0.130 0.119 102 14.8 39     Pooling  102    107
The user can also supply their own data for use in analyses using the AddGauge function. This adds a gauge to the PeakFlowData dataframe for use in the pooling analysis.
Functions within the UKFE package for importing data
There are a range of functions for importing data, as set out in this section.
Annual maximum data
An annual maximum series can be obtained for sites suitable for
pooling or QMED using the GetAM() function. This extracts
data from the embedded AMPF data frame within the UKFE
package. For other AMAX series available from the NRFA Peak Flow
Dataset, the AMImport() function can be used, as can the
GetDataNRFA() function (with Type = "AMAX").
The former function imports the data from the AM files and excludes the
years classed as rejected. The latter function extracts the AMAX using
the NRFA API. If you have a flow time series, the
AnnualStat() function can be used to extract the water year
AMAX (or any other annual statistic of interest). The following example
uses the GetAM() option.
# Extract the AMAX data for NRFA site 55002 and save to an object called 'AM.55002'
AM.55002 <- GetAM(55002)

# View the head of the AMAX series
head(AM.55002)
#>         Date Flow    id
#> 1 1985-12-22  400 55002
#> 2 1986-11-20  457 55002
#> 3 1988-01-03  393 55002
#> 4 1989-03-24  360 55002
#> 5 1990-02-08  481 55002
#> 6 1991-01-10  412 55002

# Plot the AMAX data
AMplot(AM.55002)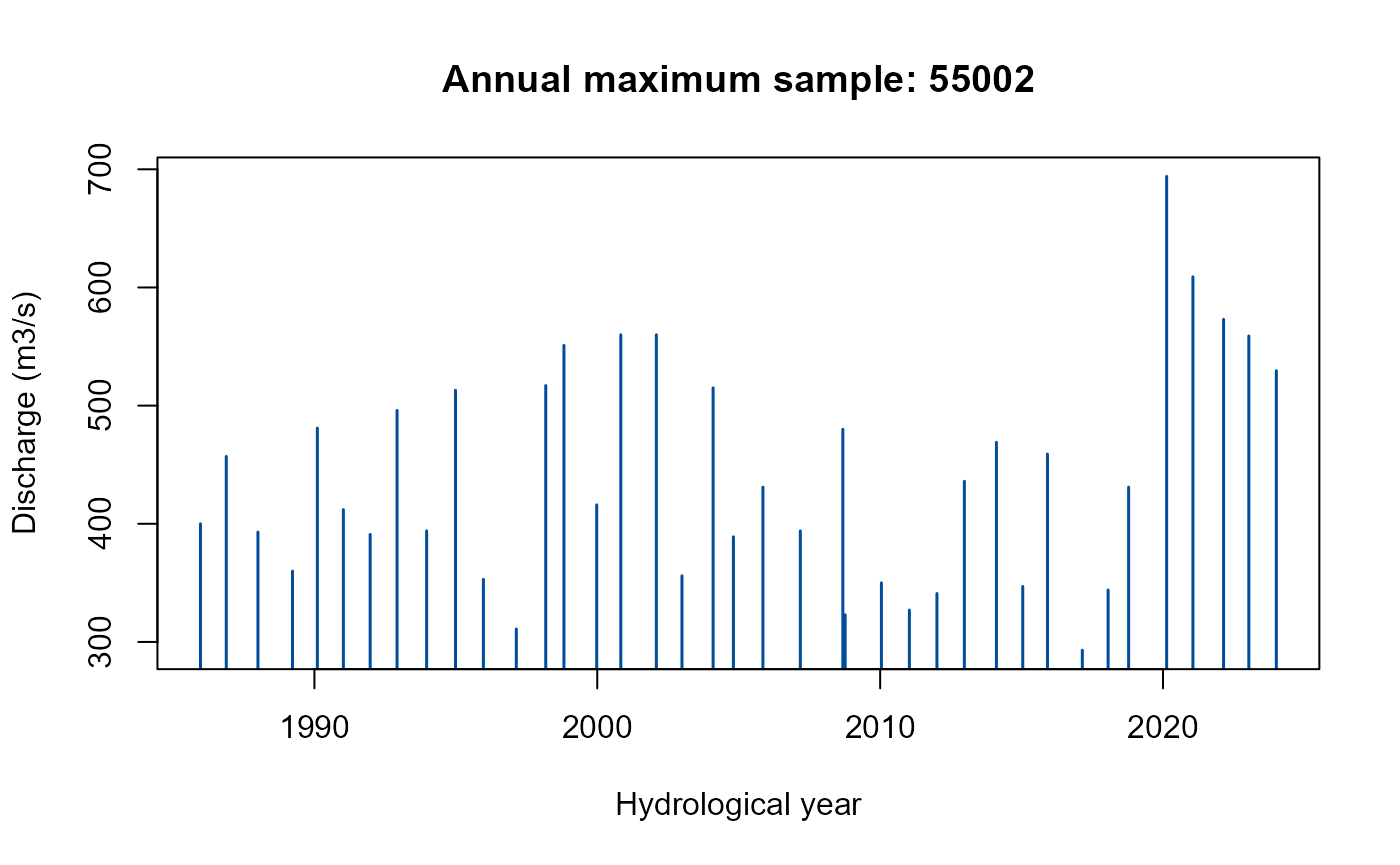
The AMplot() function returns a time series bar plot of
the AMAX series.
Catchment descriptors
Catchment descriptors (CDs) from the NRFA can be brought into the ‘R’
environment using the GetCDs() function. For gauged sites
that are suitable for pooling or QMED, these are extracted from the
PeakFlowData data frame, otherwise, they are extracted
using the NRFA API. Note that if they are brought in from the NRFA API
(when not suitable for QMED or pooling), some of the descriptors differ;
for example, the gauge location is provided rather than the catchment
centroid. There will be a warning message when this happens. An example
of using the GetCDs() function to view the catchment
descriptors for the gauge with an NRFA ID of 39001 is as follows:
# Extract and view catchment descriptors for NRFA gauge 39001
GetCDs(39001)
#>         Descriptor       Value
#> 1             AREA   9931.0000
#> 2           ALTBAR    109.0000
#> 3           ASPBAR    108.0000
#> 4           ASPVAR      0.0800
#> 5  BFIHOST19scaled      0.6760
#> 6        BFIHOST19      0.6790
#> 7          BFIHOST      0.6530
#> 8           DPLBAR    139.9000
#> 9           DPSBAR     42.0000
#> 10        FARL2015      0.8732
#> 11            FARL      0.9420
#> 12           FPEXT      0.1476
#> 13             LDP    269.6000
#> 14         PROPWET      0.3000
#> 15         RMED.1H     10.8000
#> 16         RMED.1D     32.7000
#> 17         RMED.2D     41.5000
#> 18        SAAR9120    753.0000
#> 19        SAAR6190    706.0000
#> 20        SAAR4170    724.0000
#> 21         SPRHOST     26.9400
#> 22      URBEXT2015      0.0792
#> 23      URBEXT2000      0.0664
#> 24      URBEXT1990      0.0426
#> 25       DrainDens      0.7870
#> 26           CEast 462899.0000
#> 27          CNorth 187850.0000
It’s useful to store them as an ‘object’ for use with other
functions, in which case you can give them a name. You can assign the
data to the named object using <-. For example:
# Extract catchment descriptors for NRFA gauge 39001 and store in an object called
# 'CDs.39001'
CDs.39001 <- GetCDs(39001)
Then, when you wish to view them, the object name
CDs.39001 can be entered into the console.
If you wish to derive CDs from an XML file (typically from UKCEH FEH
webservice or the NRFA peak flows dataset) for catchments that aren’t
suitable for pooling or QMED, or are not gauged at all, you can use the
CDsXML() function. The file path will need to be used. For
Windows operating systems, the backslashes will need to be changed to
forward slashes, or the file path will need to be stated as follows:
r"{my\file\path}". For example, you can import some
descriptors downloaded from the FEH Web Service as follows:
# Extract catchment descriptors from an xml file and store in an object called
# 'CDs.MySite'
CDs.MySite <- CDsXML("C:/Data/FEH_Catchment_384200_458200.xml")

# As above but retaining backslashes in the file path
CDs.MySite <- CDsXML(r"{C:\Data\FEH_Catchment_384200_458200.xml}")
Or if importing CDs from the NRFA Peak Flow Dataset:
Other hydrological data retrieval functions using APIs
There are several functions with names starting with
GetData that extract data from the websites of different
organisations using their APIs. These are:
GetDataEA_QH(): Extracts flow or level data from the Environment Agency’s Hydrology Data Explorer.GetDataEA_Rain(): Extracts rainfall data from the Environment Agency’s Hydrology Data Explorer.GetDataMetOffice(): Extracts regional mean (monthly, seasonal and annual) temperature or rainfall from the UK Met Office. Sunshine duration is also available.GetDataNRFA(): Extracts National River Flow Archive data (daily mean flow or catchment rainfall, AMAX, POT, gaugings and metadata).GetDataSEPA(): Extracts flow, level, or rain data from the Scottish Environment Protection Agency.
There are examples for all of these within each function’s help file.