Extracts independent peaks over a threshold from a sample, using time as the independence criteria.
Usage
POTt(
  x,
  threshold = 0.975,
  div,
  Plot = TRUE,
  PlotType = "l",
  main = "Peaks over threhsold",
  ylab = "Magnitude",
  xlab = "Time"
)
Arguments
- x
either a numeric vector or dataframe with date (or POSIXct) in the first column and hydrological variable in the second
- threshold
user chosen threshold. Default is 0.975
- div
number of time steps between peaks to ensure independence.
- Plot
logical argument with a default of TRUE. When TRUE, the full hydrograph with the peaks over the threshold highlighted is plotted
- PlotType
Type of plot with a default of "l" for line graph. For rainfall type "h" for bars could be used.
- main
Title for the plot. Default is "Peaks over threshold"
- ylab
Label (character) for the plot y axis. Default is "Magnitude"
- xlab
Label (character) for the plot x axis. Default is "Time".
Value
A data.frame with columns; Date and peak, with the option of a plot. Or a numeric vector of peaks is returned if only a numeric vector of the variable is input as x.
Details
This provides a quicker option than the POTextract function - useful for very long time series'. It only has the option of time division to ensure independence between peaks. If the x argument is a numeric vector, the peaks will be extracted with no time information. x can instead be a data.frame with dates in the first column and the numeric vector in the second. In this latter case, the peaks will be time-stamped and a hydrograph, including POT, will be plotted by default.
Examples
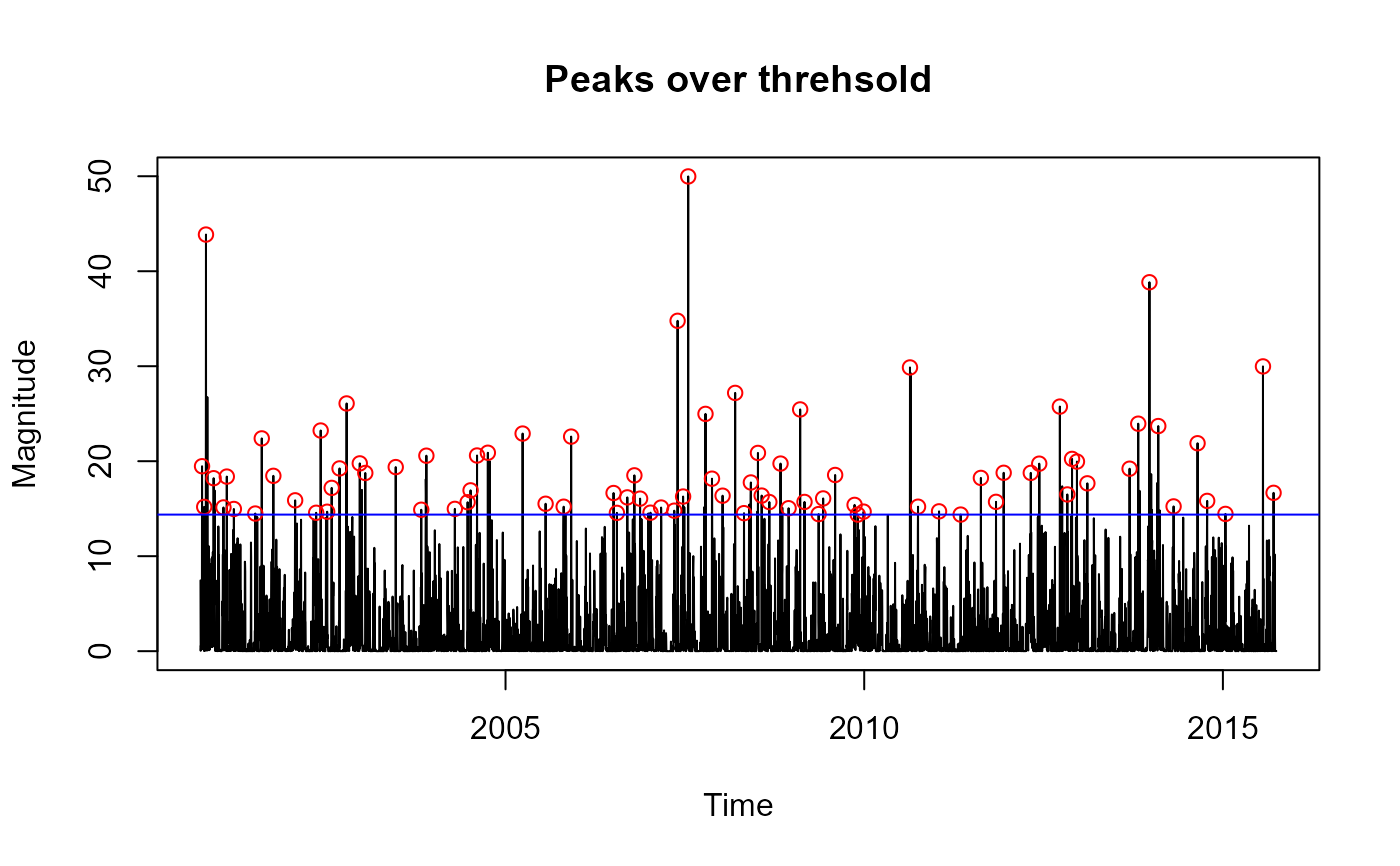
# Extract POT data from Thames catchment daily rainfall 2000-10-01 to 2015-09-30 with
# div = 14 (14 days) and threshold = 0.975, and display the first six rows
thames_p_pot <- POTt(ThamesPQ[, c(1, 2)], div = 14, threshold = 0.975)

head(thames_p_pot)
#>         Date     P
#> 1 2000-10-09 19.47
#> 2 2000-10-20 15.19
#> 3 2000-10-29 43.86
#> 4 2000-12-07 18.21
#> 5 2001-01-26 15.13
#> 6 2001-02-12 18.38

# Extract Thames rainfall POT from the numeric vector of rainfall, with threshold
# set to 0.95 and div set to 14, and display the first six rows
thames_p_pot <- POTt(ThamesPQ[, 2], threshold = 0.95, div = 14)
head(thames_p_pot)
#> [1] 19.47 15.19 43.86 18.21 13.13 15.13
head(thames_p_pot)
#> Date P
#> 1 2000-10-09 19.47
#> 2 2000-10-20 15.19
#> 3 2000-10-29 43.86
#> 4 2000-12-07 18.21
#> 5 2001-01-26 15.13
#> 6 2001-02-12 18.38
# Extract Thames rainfall POT from the numeric vector of rainfall, with threshold
# set to 0.95 and div set to 14, and display the first six rows
thames_p_pot <- POTt(ThamesPQ[, 2], threshold = 0.95, div = 14)
head(thames_p_pot)
#> [1] 19.47 15.19 43.86 18.21 13.13 15.13