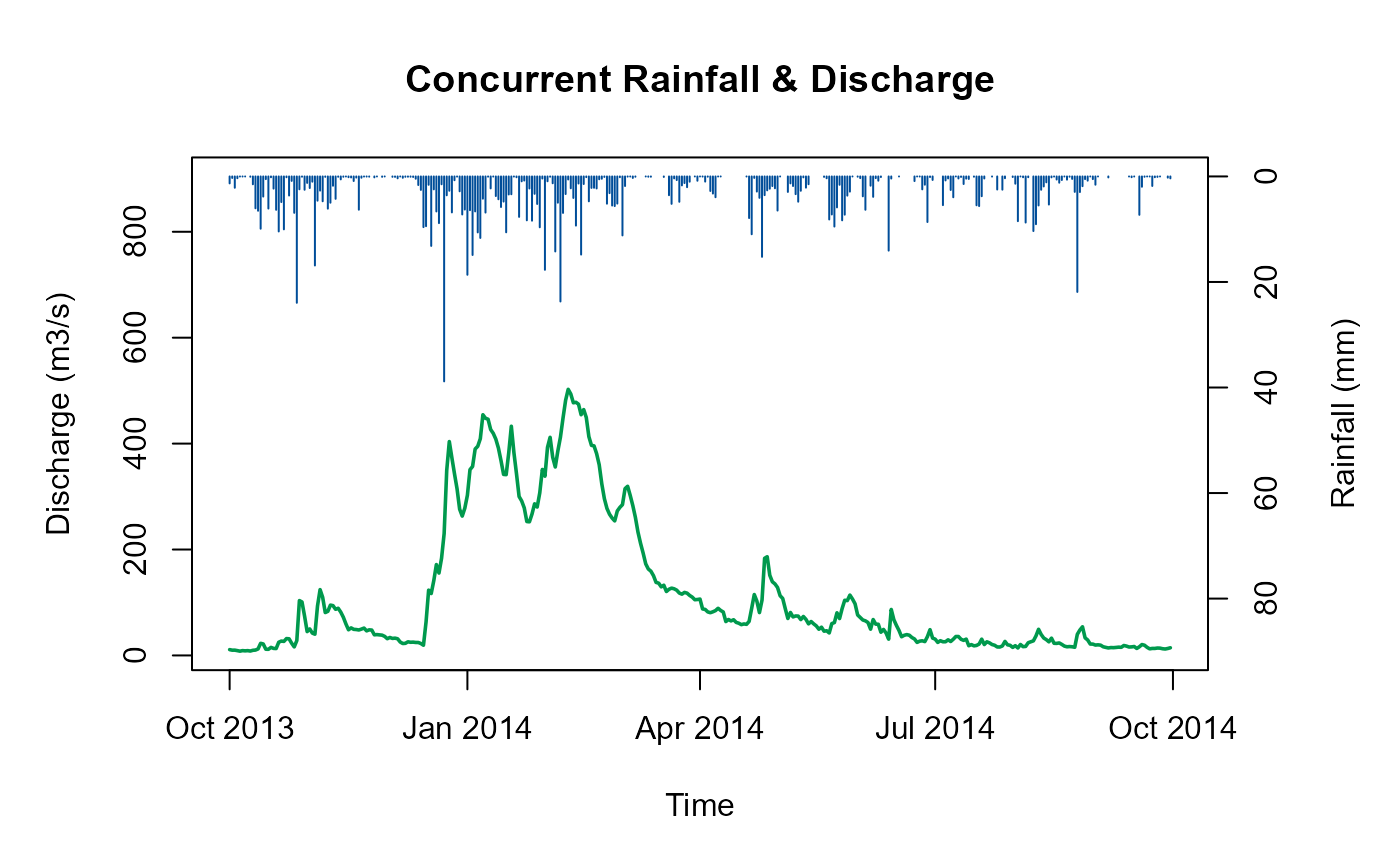
Plots concurrent precipitation and discharge, with precipitation along the top and discharge along the bottom
Usage
HydroPlot(
  x,
  main = "Concurrent Rainfall & Discharge",
  ylab = "Discharge (m3/s)",
  From = NULL,
  To = NULL,
  adj.y = 1.5,
  RainAxisMax = NULL,
  plw = 1,
  qlw = 1.8,
  Return = FALSE
)
Arguments
- x
a data.frame with three columns in the order of date (or POSIXct), precipitation, and discharge
- main
a character string. The user chosen plot title. The default is "Concurrent Rainfall & Discharge"
- ylab
User choice for the y label of the plot. The default is "Discharge (m3/s)".
- From
a starting time for the plot. In the form of a date or POSIXct object. The default is the first row of x
- To
an end time for the plot. In the form of a date or POSIXct object. The default is the last row of x
- adj.y
a numeric value to adjust the closeness of the preciptation and discharge in the plot. Default is 1.5. A lower value brings them closer and a larger value further apart
- RainAxisMax
A numeric value for to set the maximum value of the rainfall axis. This is useful for comparing multiple plots so that they have the same scale on the rainfall axis
- plw
a numeric value to adjust the width of the precipitation lines. Default is one. A larger value thickens them and vice versa
- qlw
a numeric value to adjust the width of the discharge line. Default is 1.8. A larger value thickens them and vice versa
- Return
a logical argument with a default of FALSE. If TRUE the data-frame of time, precipitation, and flow is returned
Value
A plot of concurrent precipitation and discharge, with the former at the top and the latter at the bottom. If the Return argument equals true the associated data-frame is also returned.