Estimated parameters from a sample (with Lmoments or maximum likelihood estimation) or from L1 (first L-moment), Lcv (linear coefficient of variation), and LSkew (linear skewness)
Details
The L-moment estimated parameters are by the method detailed in 'Hosking J. and Wallis J. 1997 Regional Frequency Analysis: An Approach Based on L-Moments. Cambridge University Press, New York'.
This function applies a probability distribution model which assumes that the sample data is independent and identical, i.e. the assumption is that all observations in the sample would not impact or depend on any other. Furthermore, all observations are from the same underlying process which has not changed over the period of record (stationarity).
Examples
# Get a peaks over threshold sample and estimate the parameters using L-moments
thames_pot <- POTextract(ThamesPQ[, c(1, 3)], thresh = 0.90)
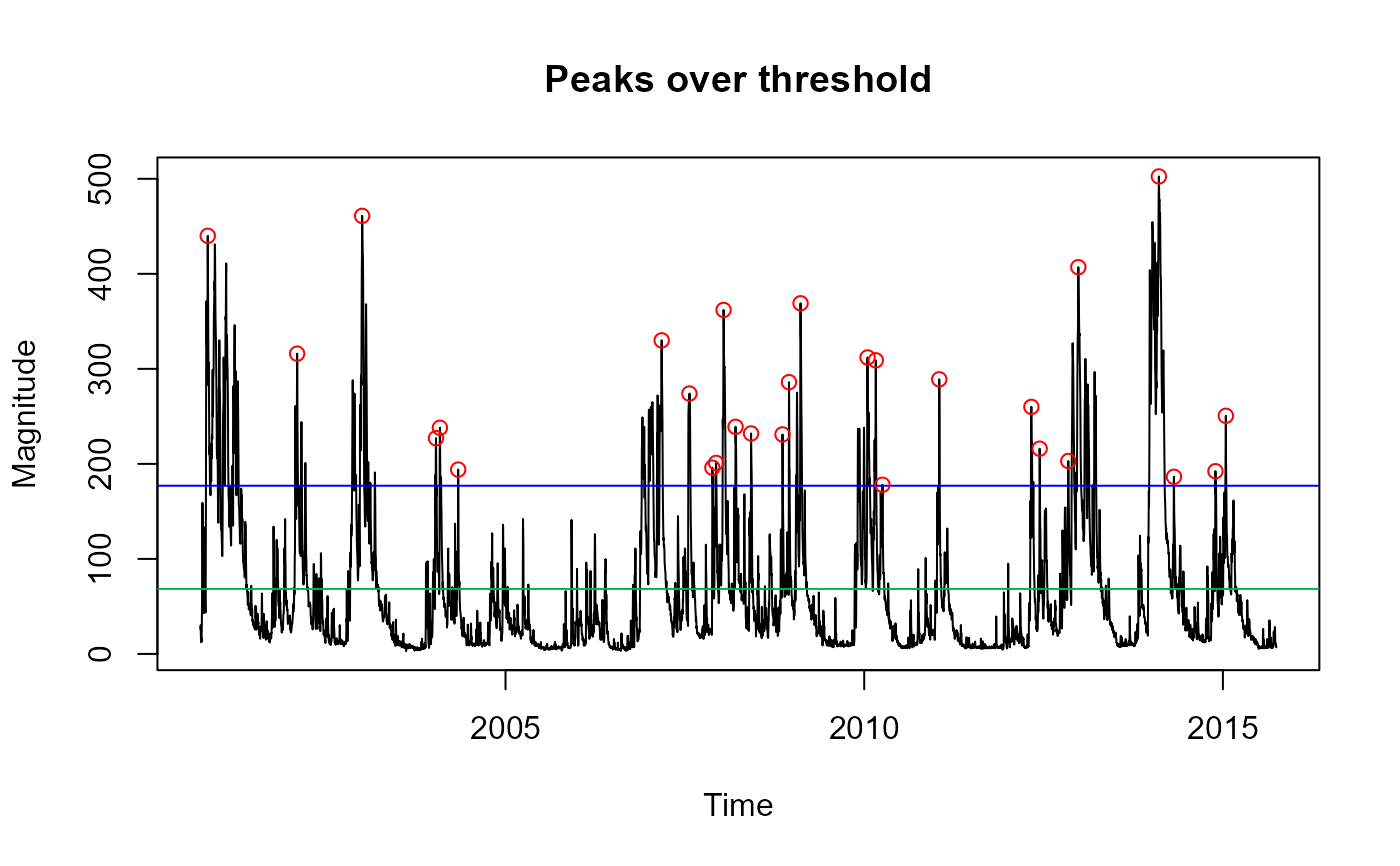 #> [1] "Peaks per year: 1.867263"
GenParetoPars(thames_pot$peak)
#> Loc Scale Shape
#> 1 174.2862 127.4085 0.1805716
# Calculate L-moments and estimate the parameters with L1, Lcv, and Lskew
LMoments(thames_pot$peak)
#> L1 L2 L3 L4 Lcv LSkew LKurt
#> 1 282.2071 49.49206 12.75092 4.774322 0.1753749 0.2576356 0.09646642
# Store L-moments in an object
l_pars <- as.numeric(LMoments(thames_pot$peak))[c(1, 5, 6)]
GenParetoPars(L1 = l_pars[1], LCV = l_pars[2], LSKEW = l_pars[3])
#> Loc Scale Shape
#> 1 174.2862 127.4085 0.1805716
#> [1] "Peaks per year: 1.867263"
GenParetoPars(thames_pot$peak)
#> Loc Scale Shape
#> 1 174.2862 127.4085 0.1805716
# Calculate L-moments and estimate the parameters with L1, Lcv, and Lskew
LMoments(thames_pot$peak)
#> L1 L2 L3 L4 Lcv LSkew LKurt
#> 1 282.2071 49.49206 12.75092 4.774322 0.1753749 0.2576356 0.09646642
# Store L-moments in an object
l_pars <- as.numeric(LMoments(thames_pot$peak))[c(1, 5, 6)]
GenParetoPars(L1 = l_pars[1], LCV = l_pars[2], LSKEW = l_pars[3])
#> Loc Scale Shape
#> 1 174.2862 127.4085 0.1805716