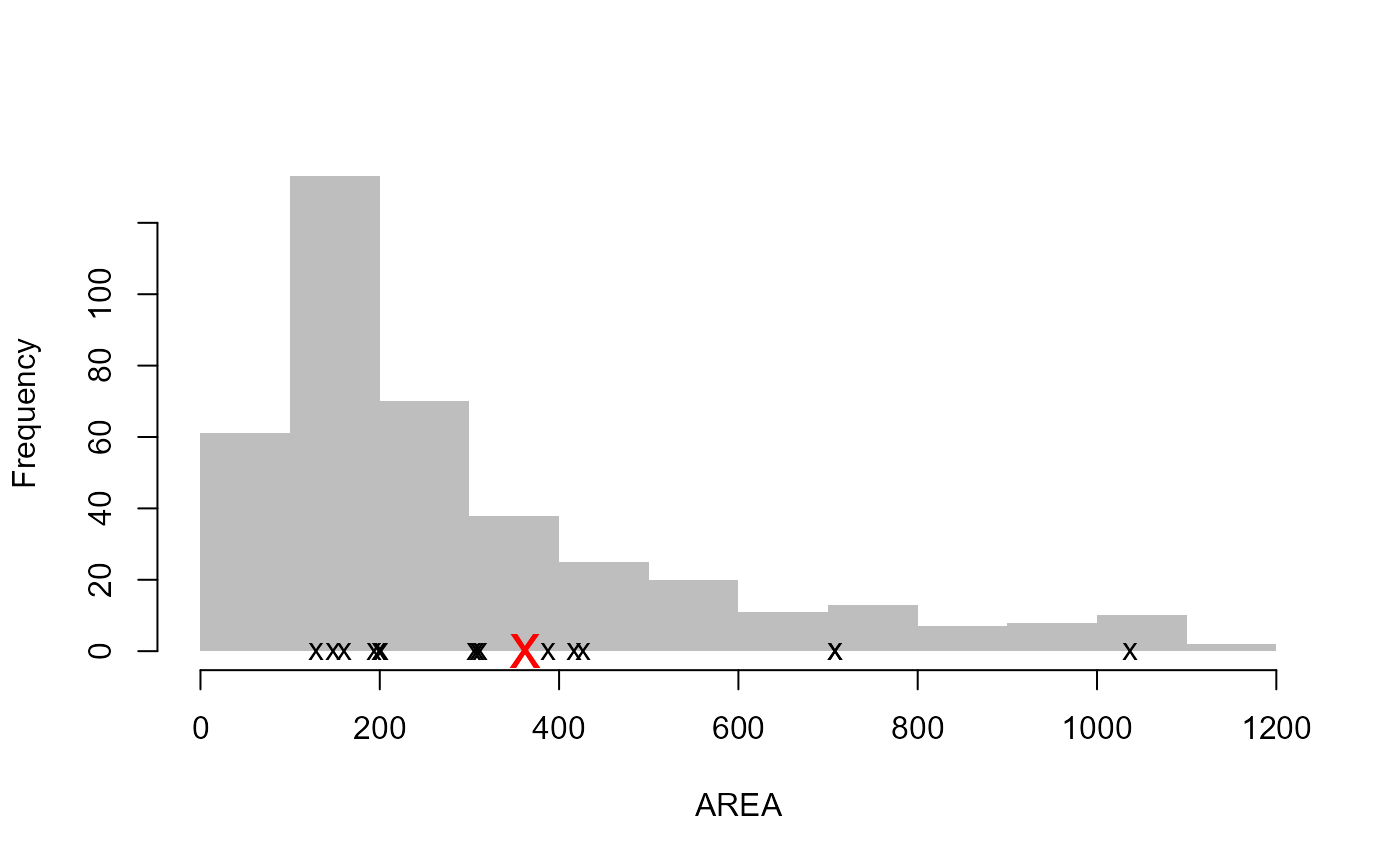
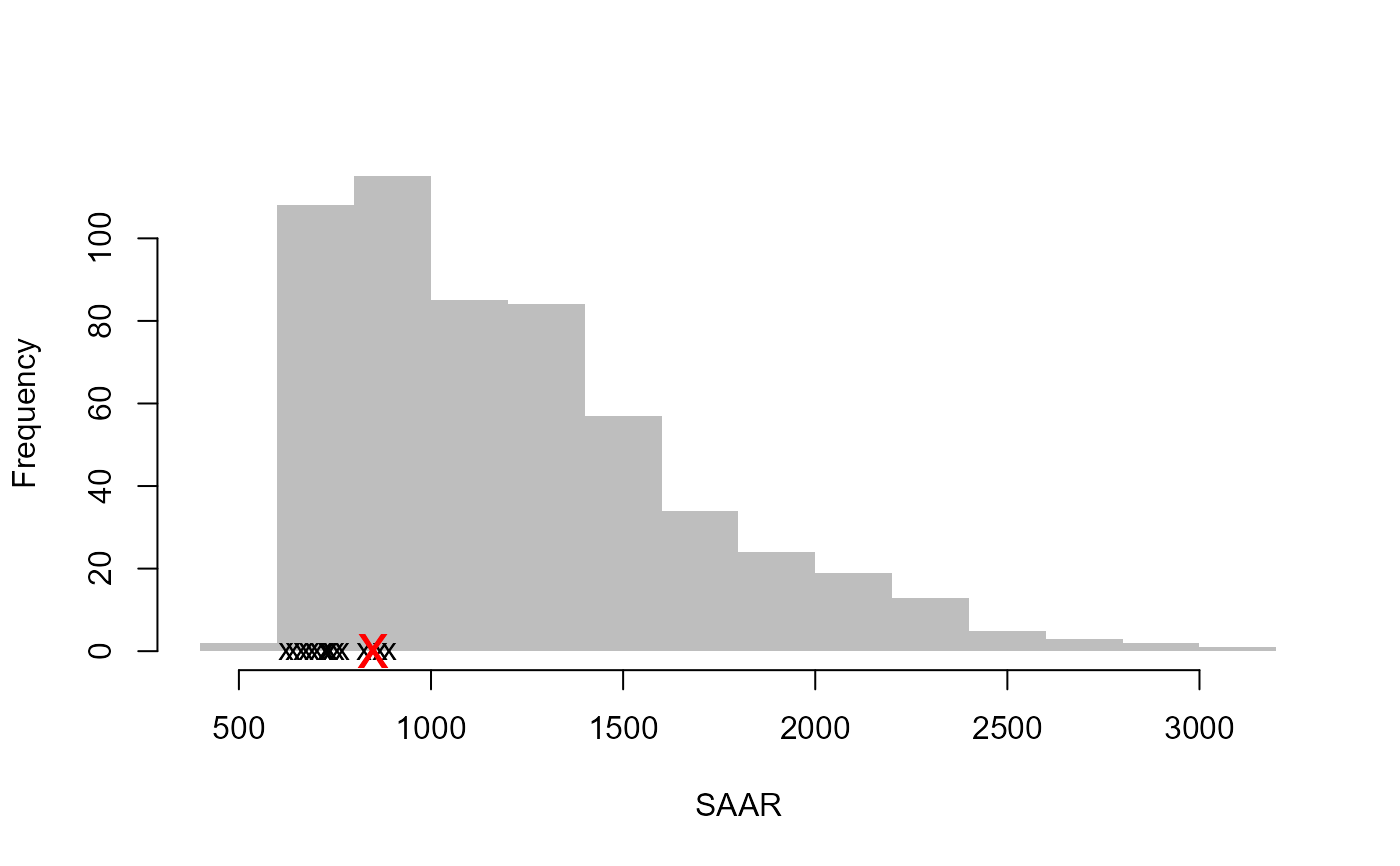
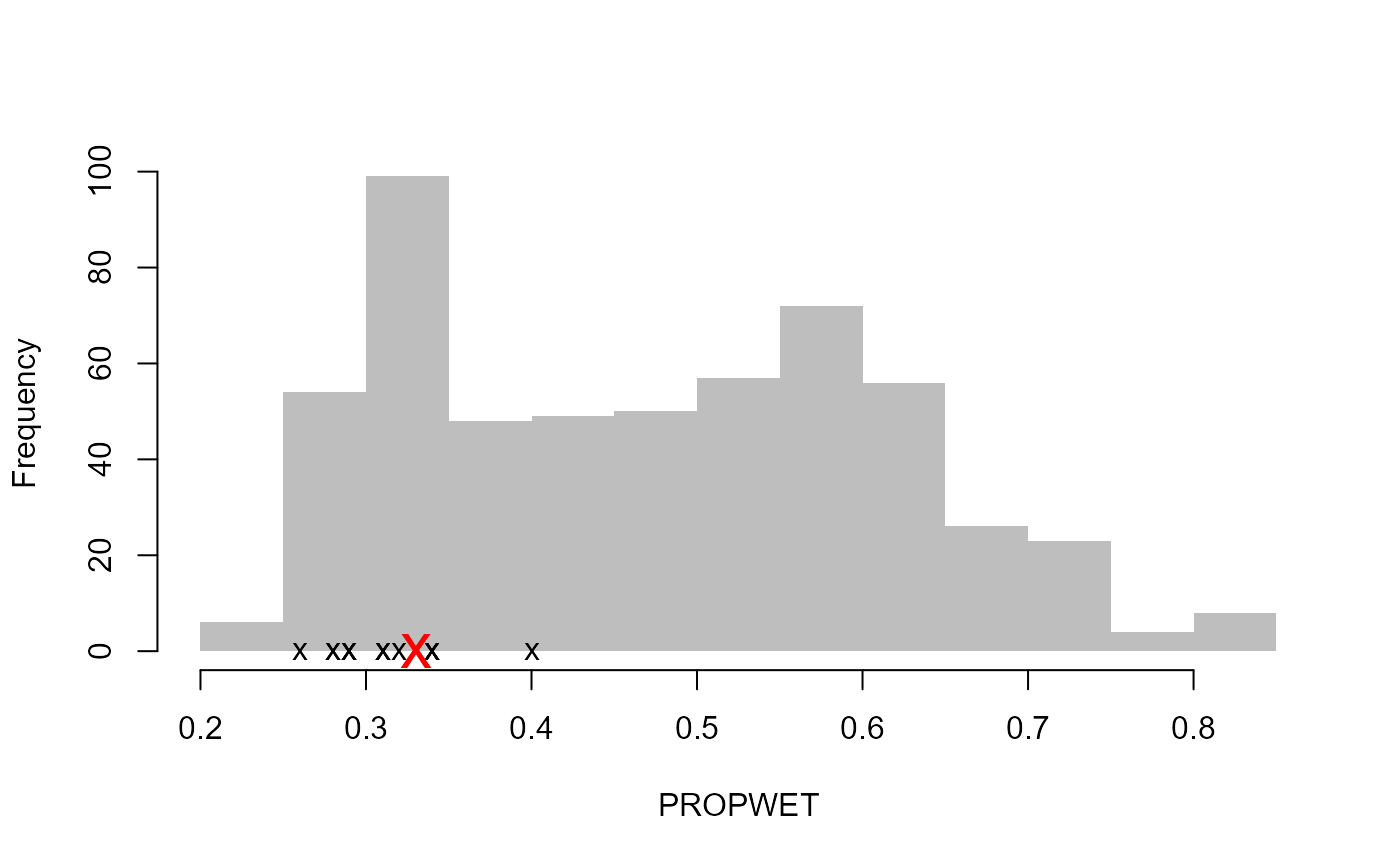
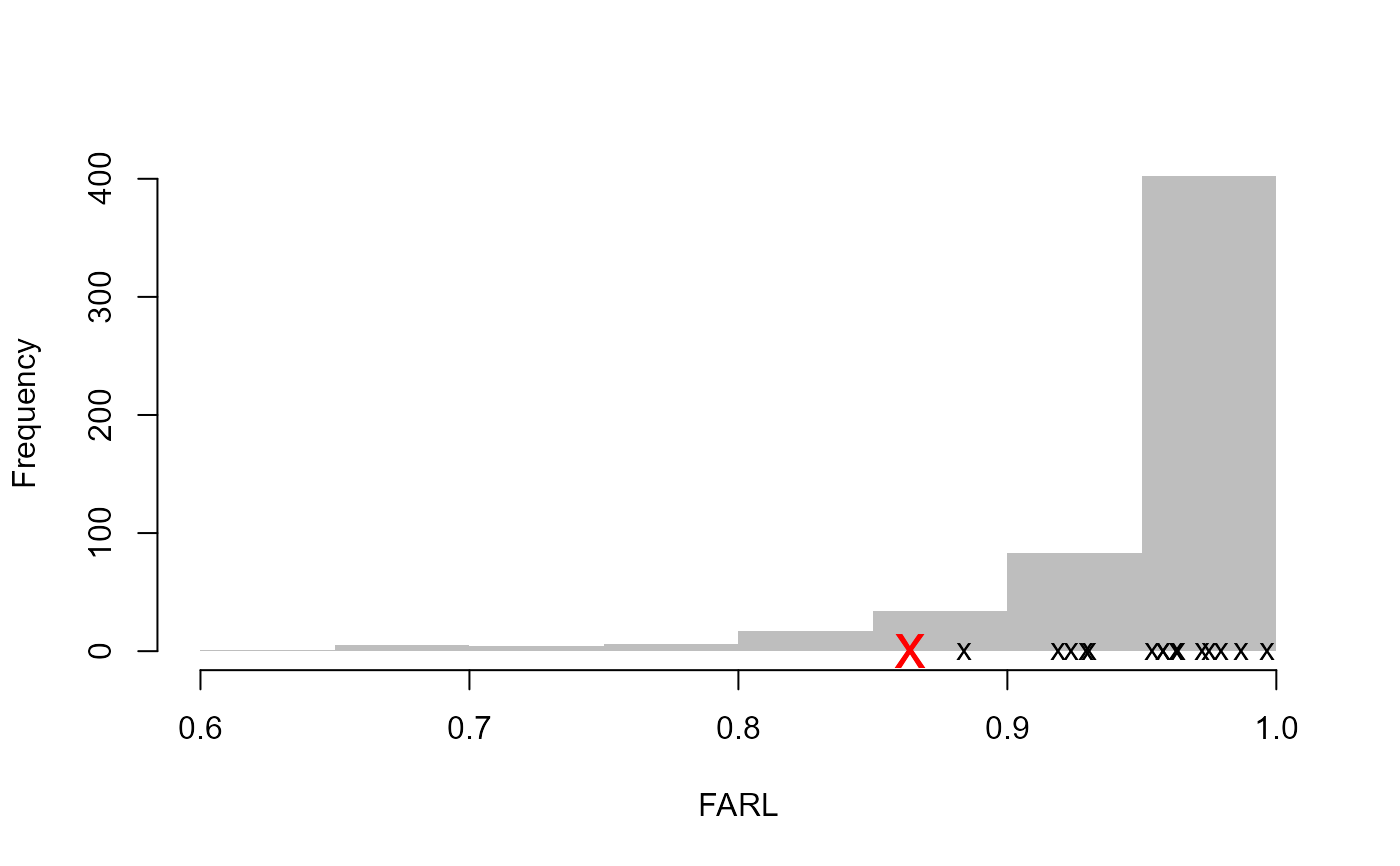
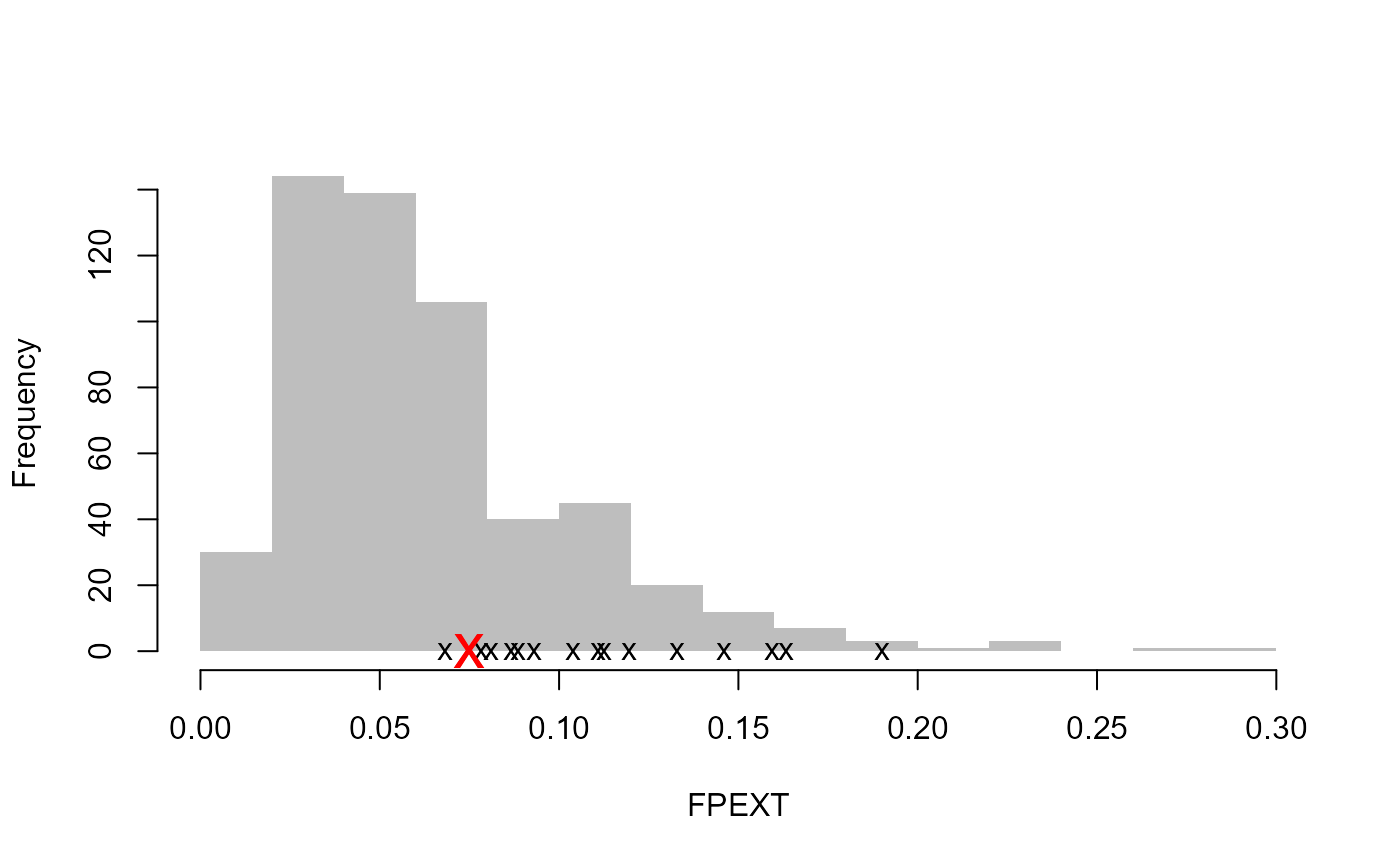
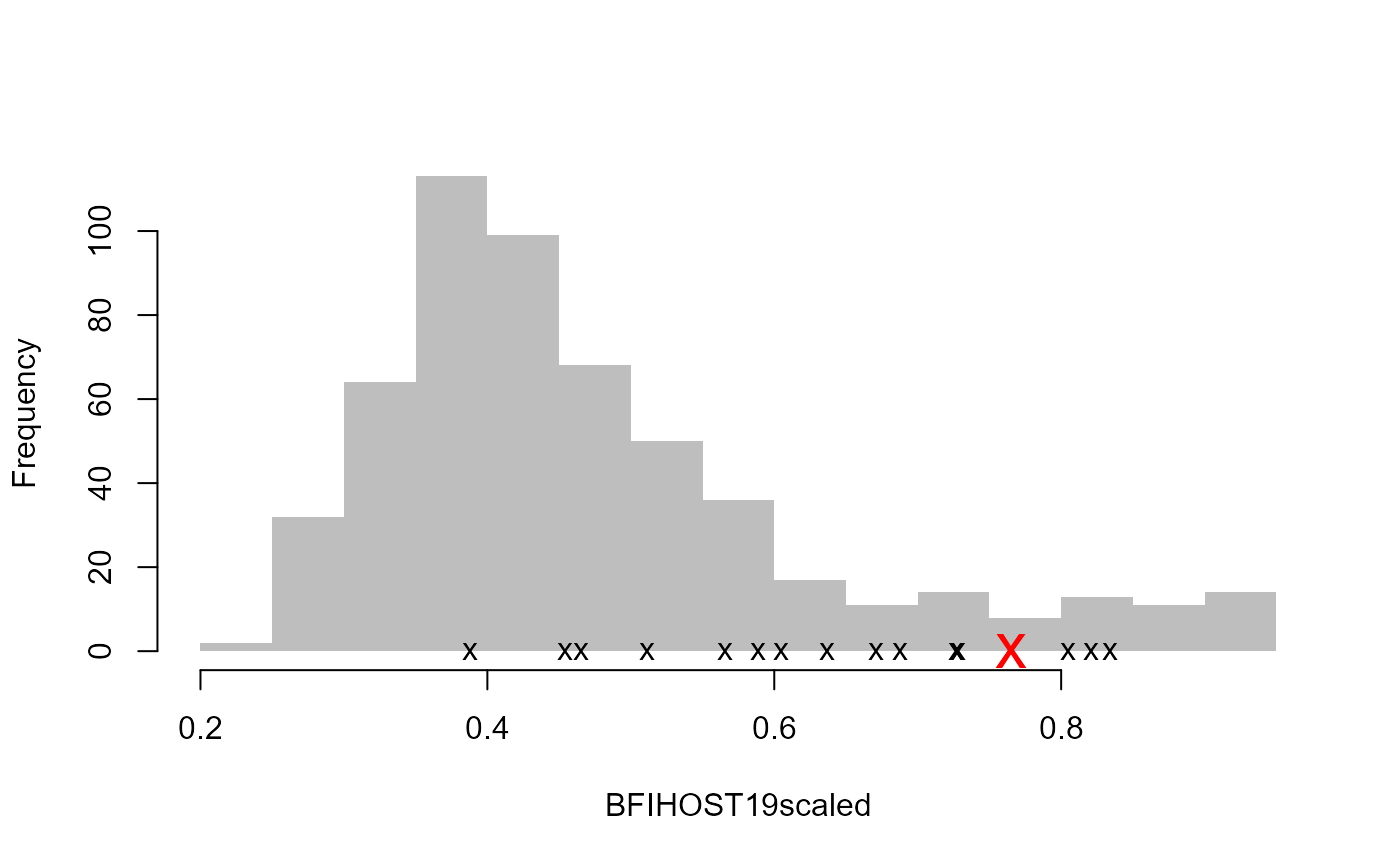
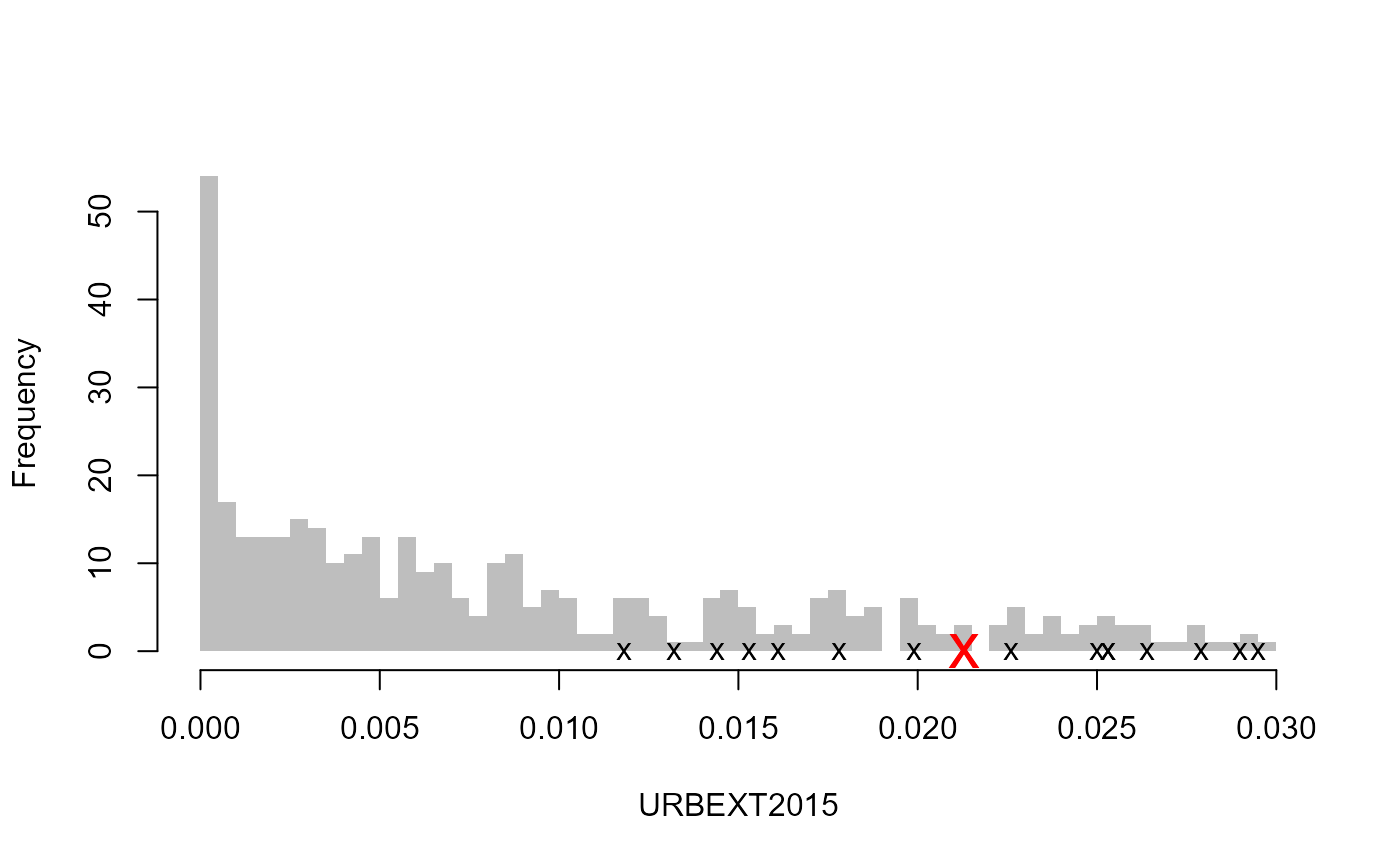
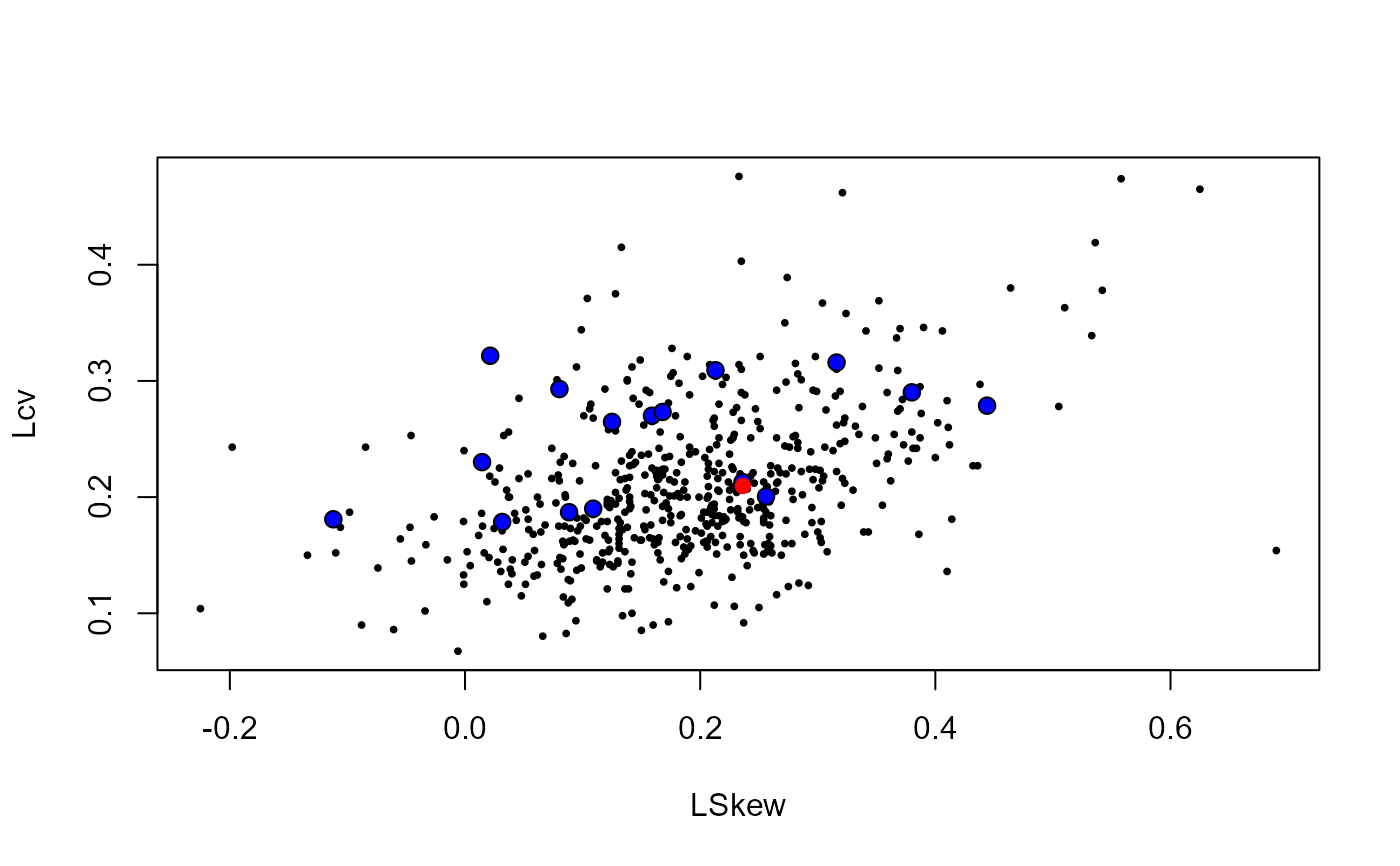
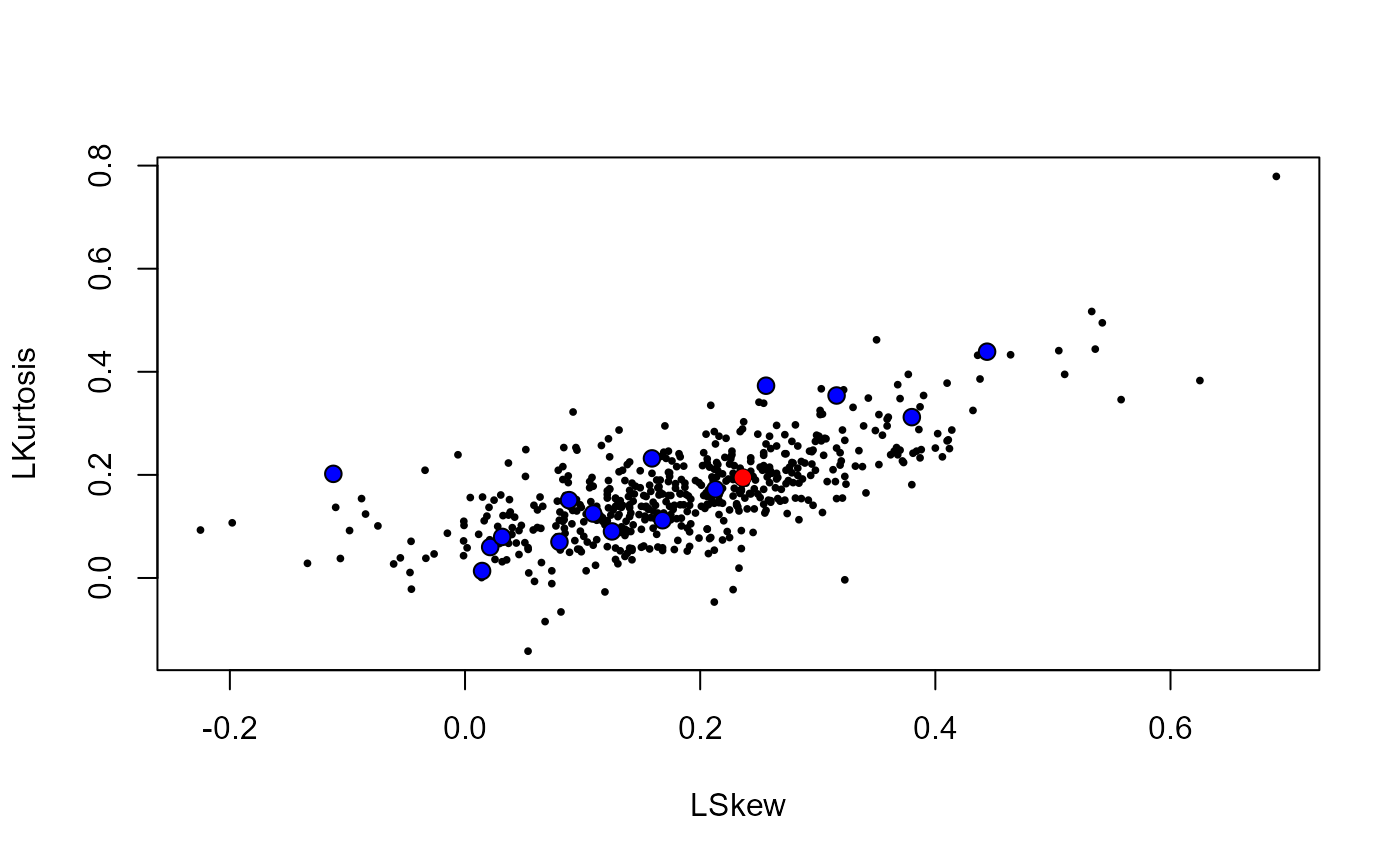
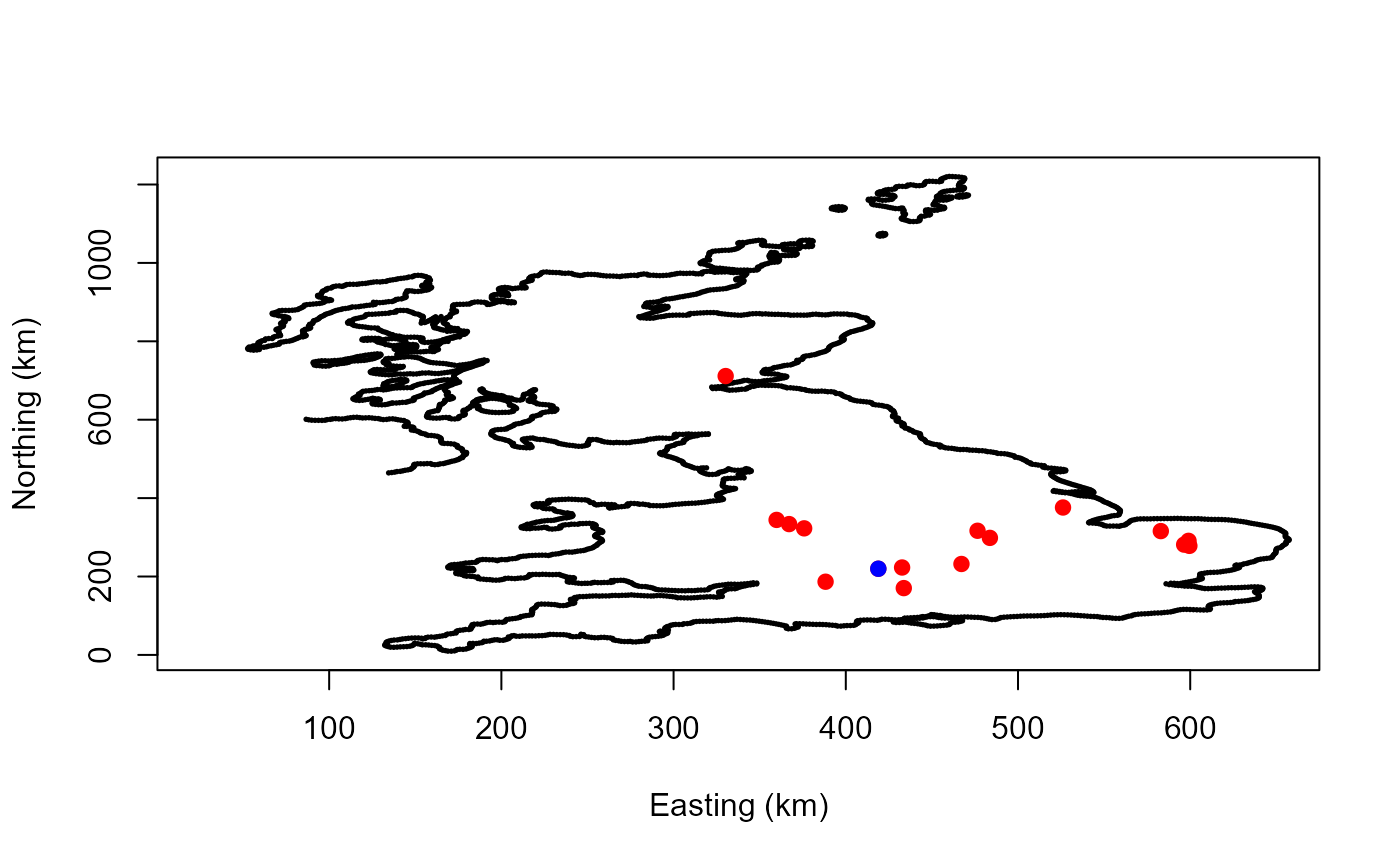
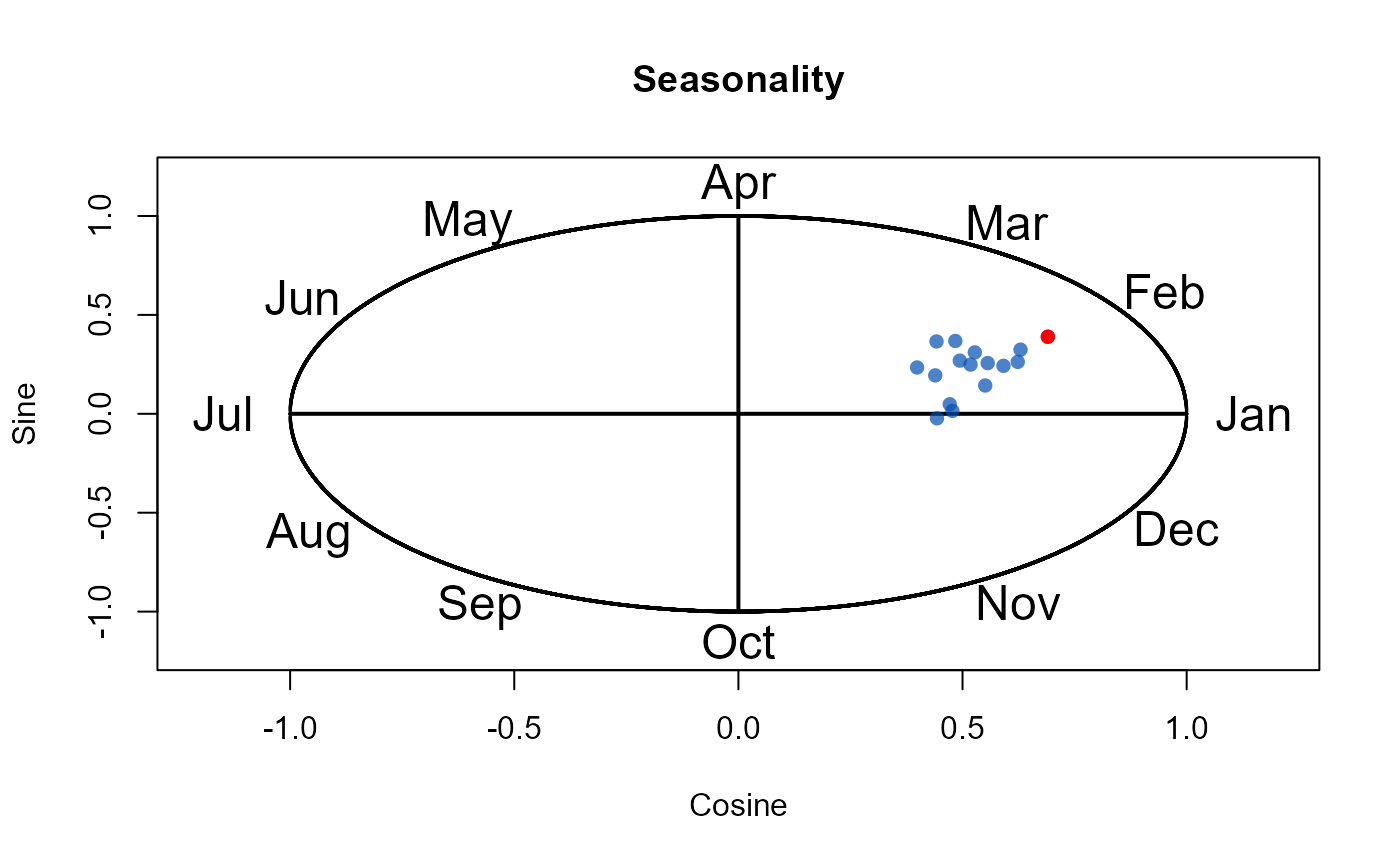
Provides 11 plots to compare the sites in the pooling group
Arguments
- x
pooling group derived from the Pool() function
- gauged
logical argument with a default of FALSE. TRUE adds the top site in the pooling group to the plots in a different colour
- UrbMax
This is for the plotting of the URBEXT comparison. Ideally it should be the same as the UrbMax used for deriving the input pooling group