Applies a linear detrend to a sample
Details
Adjusts all the values in the sample, of size n, by the difference between the linearly modelled ith data point and the linearly modelled nth data point.
Examples
# Get an annual maximum (AM) sample that looks to have a significant trend
am_21025 <- GetAM(21025)
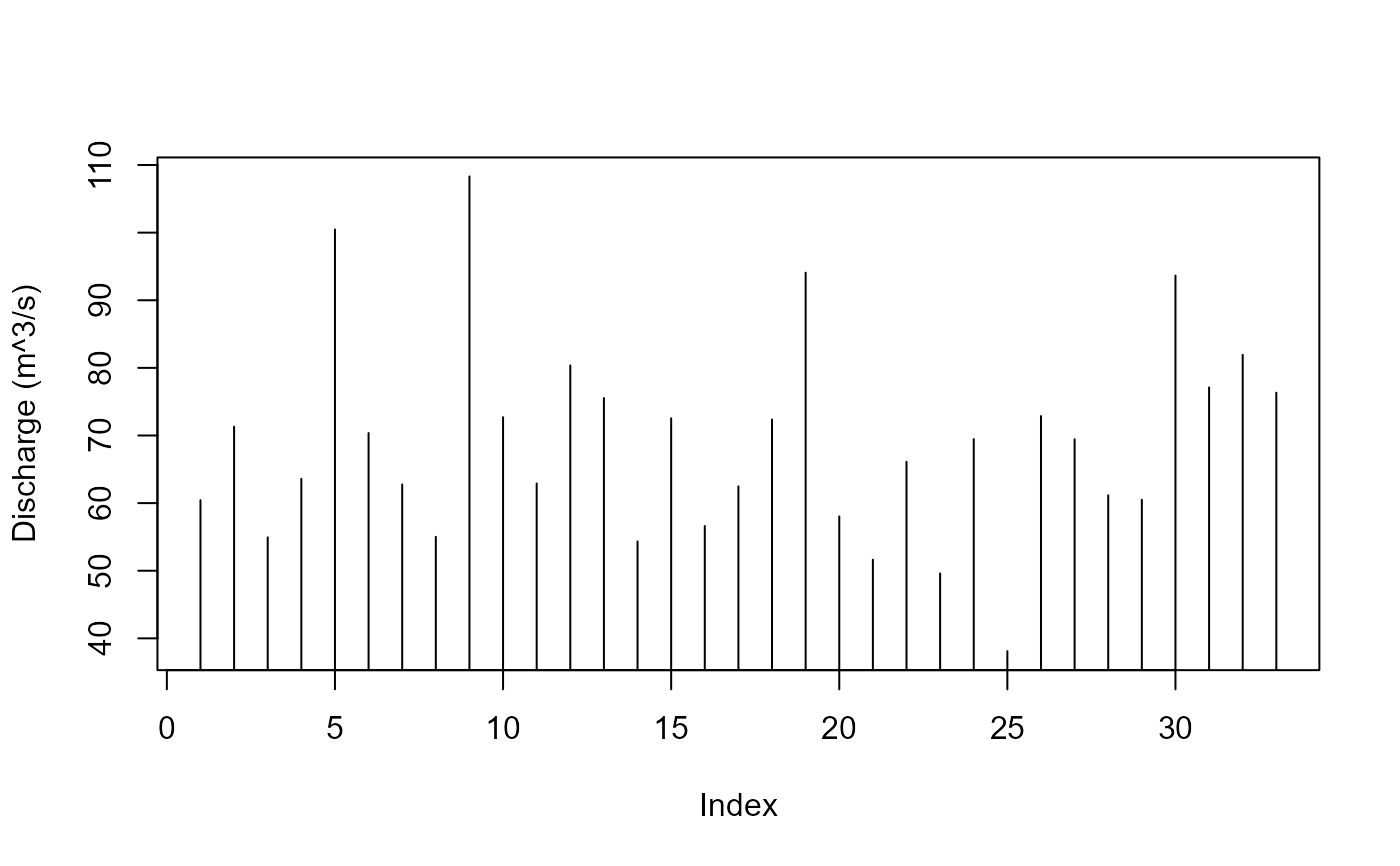
# Plot the resulting AM as a bar plot. Then detrend and compare with another plot
plot(am_21025$Flow, type = "h", ylab = "Discharge (m^3/s)")
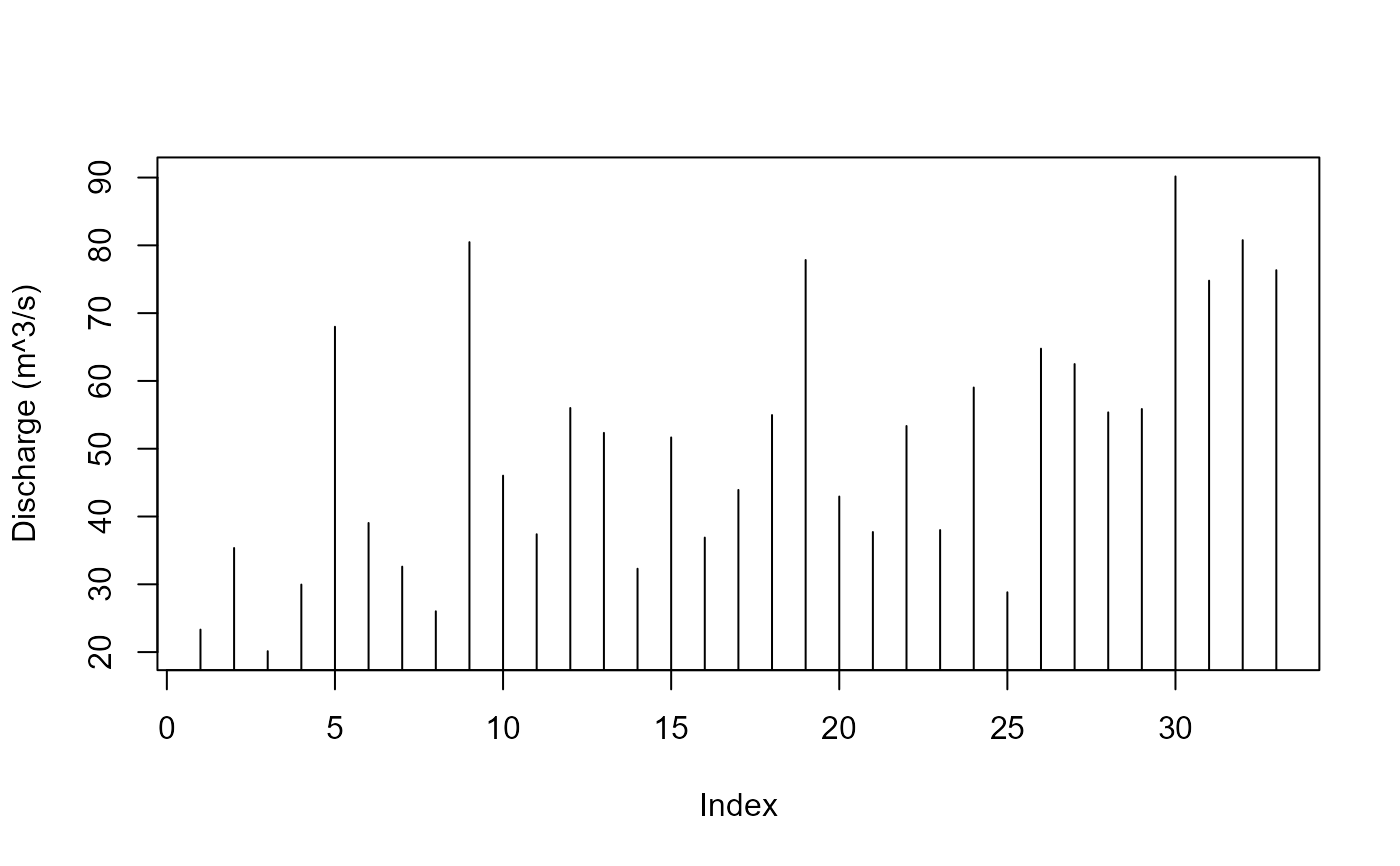 am_detrend <- DeTrend(am_21025$Flow)
plot(am_detrend, type = "h", ylab = "Discharge (m^3/s)")
am_detrend <- DeTrend(am_21025$Flow)
plot(am_detrend, type = "h", ylab = "Discharge (m^3/s)")