Calculates the baseflow index from a daily mean flow series
Arguments
- Q
the daily mean flow series. Numeric vector
- PlotTitle
the title of the plot. The default is "Baseflow plot"
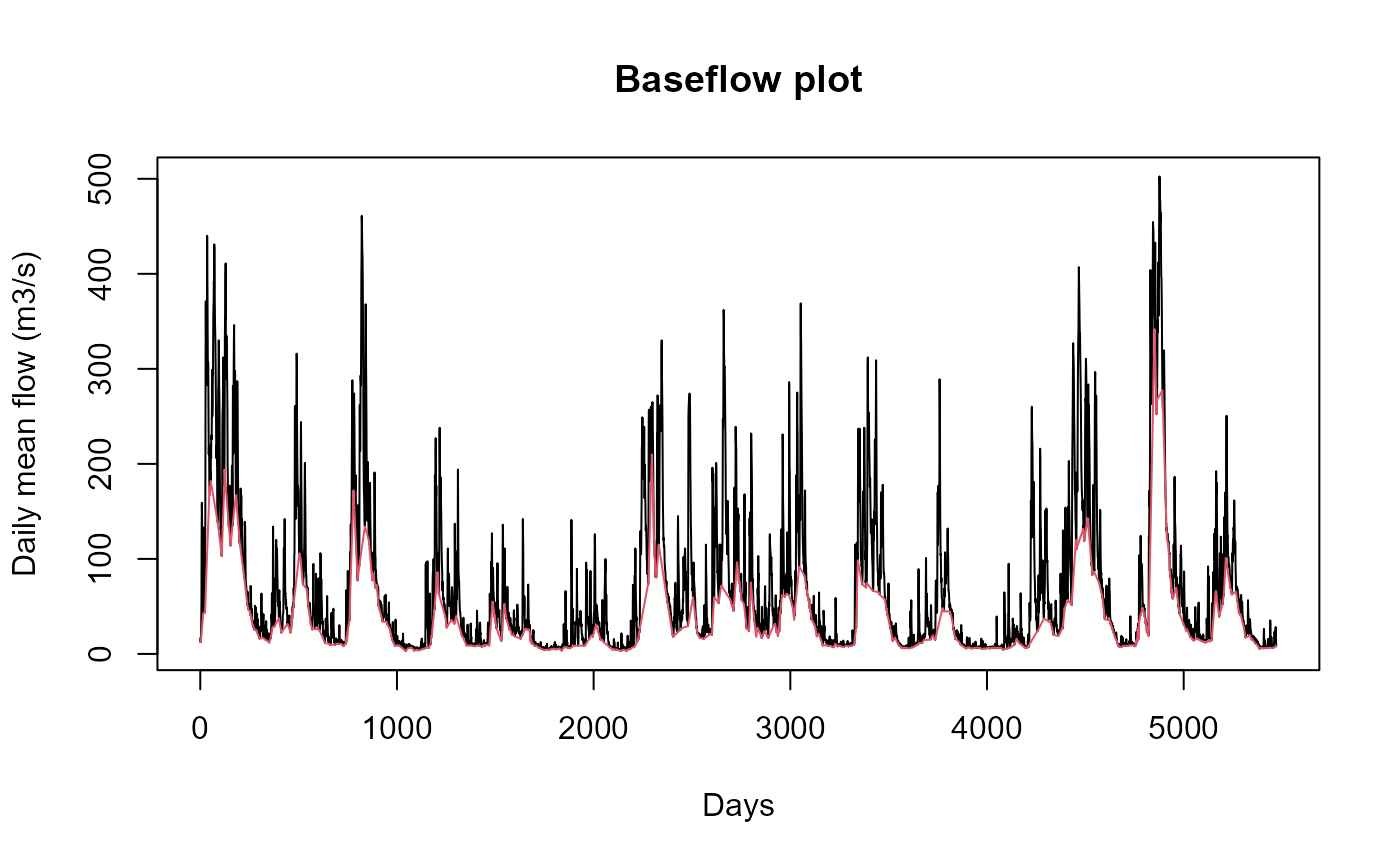
- Plot
a logical argument with a default of TRUE. If TRUE the daily flow is plotted with the baseflow highlighted.
- ReturnData
Logical statement with a default of FALSE. If TRUE, the result is a list with BFI as the first element and the second element is a dataframe with the baseflow and flow data.
Value
the baseflow index and if Plot equals TRUE, a plot showing the flow time series (black) and the associated baseflow (red). If ReturnData is set to TRUE, the result is a list with two elements. The first is the BFI, the second is a data frame with the flow data and baseflow data.